Kill alert fatigue: automating on-call with AI

Software engineers embracing AI are increasingly complaining about rising rates of burnout and pressure at their jobs.
I think that a big part of this pressure and stress is due to the increasing complexity of reliability and incident response in systems with AI-generated code.
We can leverage and adapt core principles of Site Reliability Engineering to understand this phenomenon and find ways to get our peace of mind back.
Causes
The Google SRE book has an entire chapter on dealing with interrupts. As we're pushing more and more code with AI, this part of engineering becomes even more important.
Here's why:
- The cognitive workload of an engineer in the AI era is much higher. While models do all toil—updating YAML configuration, fiddling with CI, setting up tooling—only the most challenging tasks, such as architectural review and product iteration, are left for human engineers.
- We create more software that has more failure points. So the absolute number of interrupts grows, and every interrupt is much more complex to investigate.
Possible solutions
Alert hygiene
One of the key pillars of SRE is alert hygiene. It's tempting to alert on absolutely every error that comes from your app.
However, this temptation comes with a few issues:
Responding needs time
If you have too many alerts, you just won't be able to investigate them properly:
For each on-call shift, an engineer should have sufficient time to deal with any incidents… We've found that on average, dealing with the tasks involved in an on-call incident … takes 6 hours. It follows that the maximum number of incidents per day is 2 per 12-hour on-call shift.
Betsy Beyer, Chris Jones, Jennifer Petoff, and Niall Richard Murphy (eds.), Site Reliability Engineering: How Google Runs Production Systems, O'Reilly Media, 2016. ISBN 978-1-4919-2912-4. Free online.
Alert fatigue
Another caveat with too many alerts is that humans get tired of them and start ignoring them—until an important problem gets missed.
When pages occur too frequently, employees second-guess, skim, or even ignore incoming alerts, sometimes even ignoring a "real" page that's masked by the noise.
Betsy Beyer, Chris Jones, Jennifer Petoff, and Niall Richard Murphy (eds.), Site Reliability Engineering: How Google Runs Production Systems, O'Reilly Media, 2016. ISBN 978-1-4919-2912-4. Free online.
Auditing alerts with AI
Luckily, we can use our agents to remove noisy alerts.
Ask your agent to audit your alerts or monitors—for example, using Datadog MCP—to look for:
- Flaky alerts: alerts that often go on and off, or fire multiple times for a single failure.
- Alerts that resolve on their own: a good way to find them is to use your observability tool together with Slack. If nobody acknowledged the alert, it probably wasn't that important.
- Alerts that don't require immediate action: often that is visible even in the description or configuration. Another good signal is an alert that is always red—the system is either fully down, or the threshold is too sensitive.
Automating investigations
Another easy way of removing some operational load is using AI to triage, pre-investigate, or even remediate alerts.
Most observability providers include their own set of such tools. Many teams choose to build their own investigation agents, too.
What is important
Context
Your agent is only helpful if it can correctly diagnose the issueand propose a relevant fix. It can only do so if it has the right data or context.
In my experience, here's what context an AI SRE or investigation agent needs:
- Telemetry. The most important one is access to logs, traces, and metrics. While it's useful for the agent to see the exact error log, it's useless without the logs preceding and following the issue.
- Codebase. Access to code is critical. A human investigator traces the error to its location in the source code; our investigation agent needs to do the same. It also needs to know which version is currently deployed and check release history so it can spot a parallel fix or suggest a rollback.
- Infrastructure. Some bugs involve infrastructure misconfiguration that can't be known from telemetry or code alone. The infrastructure provider often has the complete picture of how an app is running.
- Custom providers. Third-party APIs such as sandbox providers or Stripe can hold the decisive piece of operational context.
- Knowledge base and documentation. While many teams have moved key docs to AGENTS.md or CLAUDE.md, critical information can still live in Confluence and Notion. The agent needs it to understand where to look, assess impact, and communicate in the team's terms.
- Informal knowledge. Developer chats in Slack or Teams often contain release heads-ups, parallel changes, and migrations. There's a big difference between "the app is down in eu-west-3" and "we're spinning up a new region."
Noise reduction
Investigating all issues is a double-edged sword, just like alerting on all issues.
Too many issues. If your AI SRE highlights every alert as an issue, you will eventually stop reading the investigations. The investigator needs to:
- Only surface real issues and help suppress noise.
- Highlight severity and bubble up time-sensitive problems.
Too many solutions. If the AI SRE proposes pull requests, it can overwhelm reviewers and spam you with PRs. If a PR is opened, it needs to be relevant and easy to merge.
Steerability
Not all issues need a PR or a resolution, and sometimes the AI SRE will be wrong. There needs to be a way for a human to take over and steer the investigation. There are two good ways to do so:
- Only propose fixes on request. The AI SRE won't open PRs automatically, allowing people to delegate small issues while keeping the real ones to themselves.
- Let the person copy the context or prompt and continue the investigation independently with full control.
Integration with your workflow
If the investigation agent requires you to constantly open a new browser tab and fully context-switch, it's not really saving time or reducing operational load.
Good investigation agents:
- Surface issues in tools you already use, such as Slack, Teams, or Telegram.
- Play nicely with existing alerting tools, such as Datadog or Sentry.
- Integrate with SDLC tooling, such as Linear or Jira, for non-critical alerts.
Built-in investigation tools
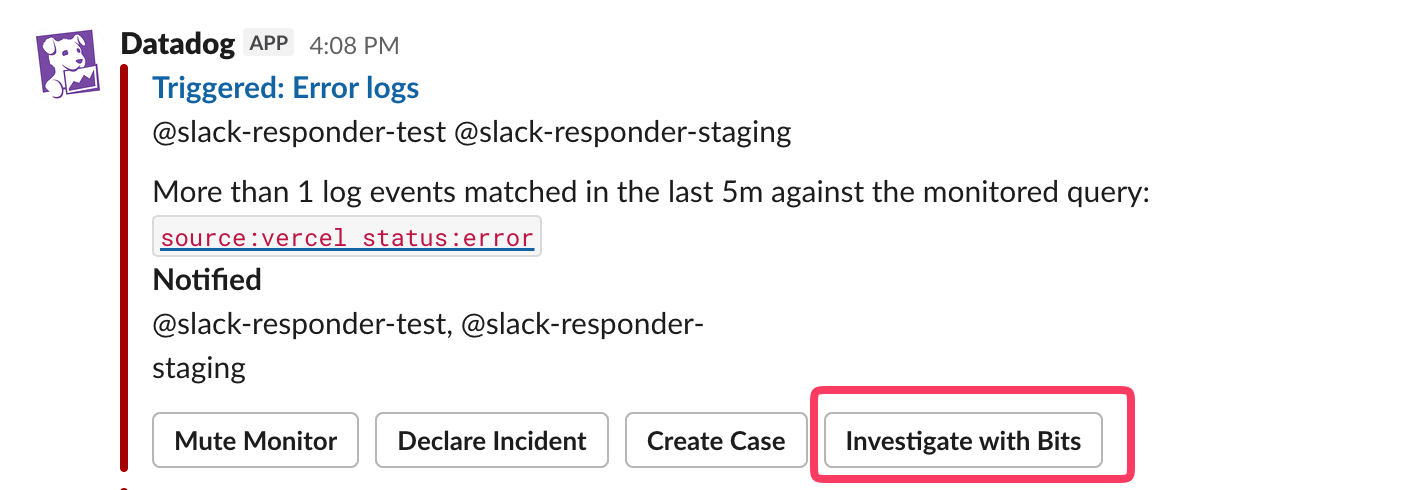
Bits AI
Bits AI is Datadog's automatic investigation tool. It can look through data inside the platform. Optionally, you can give it access to source code via GitHub or knowledge bases such as Confluence.
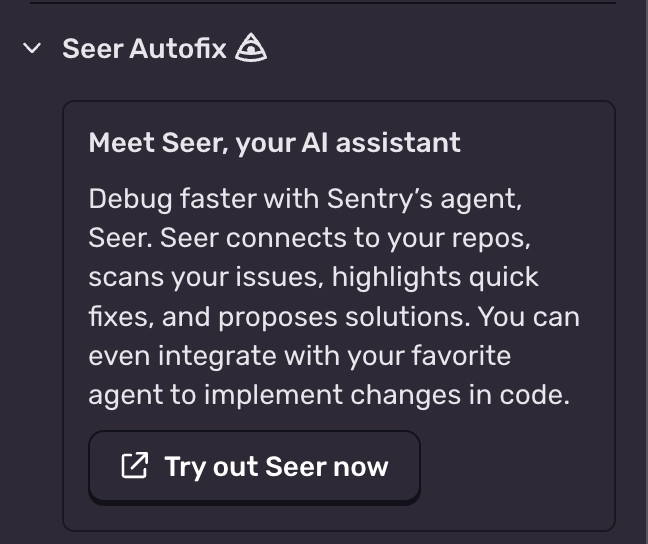
Seer
Seer is Sentry's analog to Bits. It can use data already available to Sentry as well as the codebase. At the moment, it doesn't have access to your knowledge bases or custom MCP tools.
Conclusion
Built-in investigation tools are convenient because they automatically have relevant telemetry and often have access to your repository.
However, they almost never solve triage—highlighting the severity of an alert—and rarely have access to advanced context such as:
- Infrastructure
- Third-party providers
- Knowledge bases, with limited support in Bits AI
Building your own AI investigation agent
A good alternative to built-in tools could be building your own investigation agent. We've seen teams build this using mainstream coding agents such as:
- Claude, using Routines or @tag
- Codex
- Cursor
Two run modes
Usually, the workflow is built in one of two ways:
Daily or hourly review
In this mode, the agent uses a telemetry MCP tool to scan for new errors every hour, day, or week.
The issues with this approach are:
- Errors are triaged with a delay determined by the workflow cadence.
- The agent doesn't know which issues have already been reported or addressed.
Event-driven workflow
In this mode, the agent reacts to new errors or alerts from Sentry or Datadog via a webhook. The main advantage is immediate triage.
However:
- The agent still can't track issues unless it has a database.
- Proposing a fix for every alert can quickly create too many pull requests.
Cost
One of the big issues with running such an agent is that it can consume either the maintainer's subscription or API credits from the AI provider.
Subscription usage can eat into the limits needed for normal work. API costs can add up quickly and are difficult to control.
Tuning and maintenance
Like PR review bots, the granularity and sensitivity of triage are hard to tune. If the investigation agent is too eager, it identifies too many noisy issues. If it's too lax, it misses real failures.
Different teams use different tools, so overlapping configurations can quickly accumulate and be lost when the maintainer changes projects or teams.
Responder
Responder is an alternative to built-in AI SREs and custom investigation agents.
We've built Responder to give every team a framework for building an investigation agent with:
- The right context
- Less noise
- A workflow that fits the team
Connections
Responder lets you connect your agent to:
- Telemetry tools such as Sentry and Datadog
- Infrastructure providers such as AWS and Vercel
- Third-party tools through API keys securely stored in Secrets
- Your knowledge bases and any custom MCPs
- Informal knowledge stored in selected Slack channels
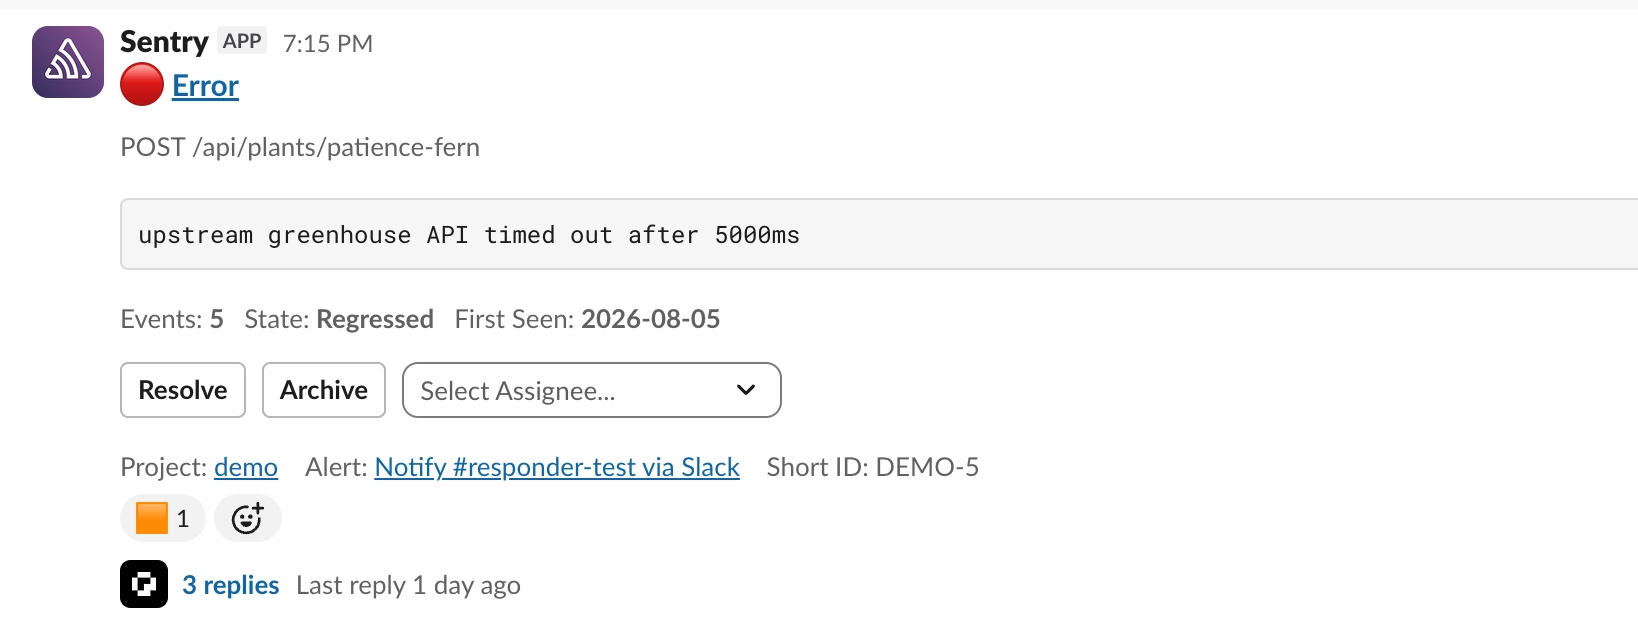
Triage
For every alert, Responder determines the severity of the issue and gives it a SEV1–3 rating. The severity is visible on every alert message so urgent issues rise above the noise.
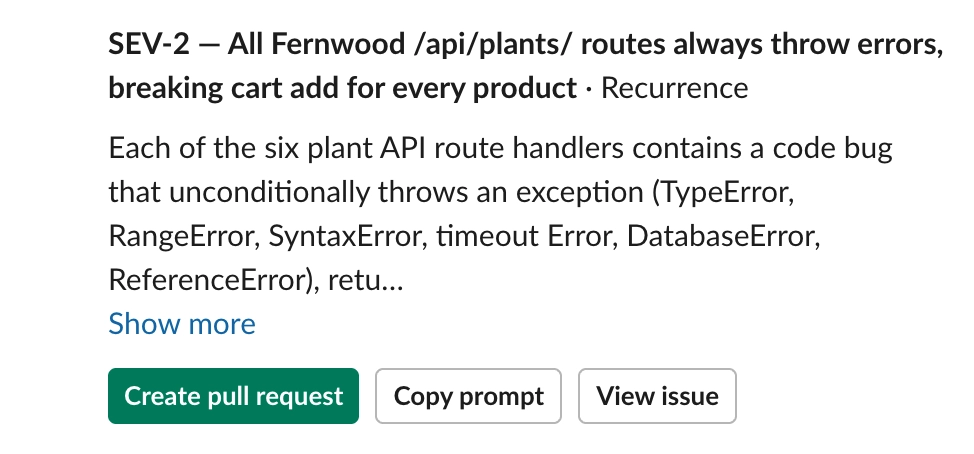
Handover
For every issue, Responder can provide a PR to fix it or let you copy the prompt and investigate manually.
Responder can also create Linear tickets, selecting the right project and respecting your issue format.
Conclusion
There are a few ways to reduce the operational load and pressure created by AI development speed:
- Maintain alert hygiene to reduce alert fatigue.
- Use platforms' internal AI tools to investigate issues.
- Use managed platforms such as Responder to create bespoke investigation agents.
If you'd like to give Responder a try, sign up here.
Responder has a free tier that fits most teams and lets them start reducing alert fatigue for free.